Chapter 3 Results
3.1 Exploratory Data Analysis
Before diving into the analysis of the corpus, we shall first explore the distribution and characteristics of the reviews and the reviewed restaurants. Since our corpus is a not-necessarily random sample of Yelp reviews, the insights below only may not reflect the true distribution or characteristics of the reviewed restaurants or reviews on Yelp.
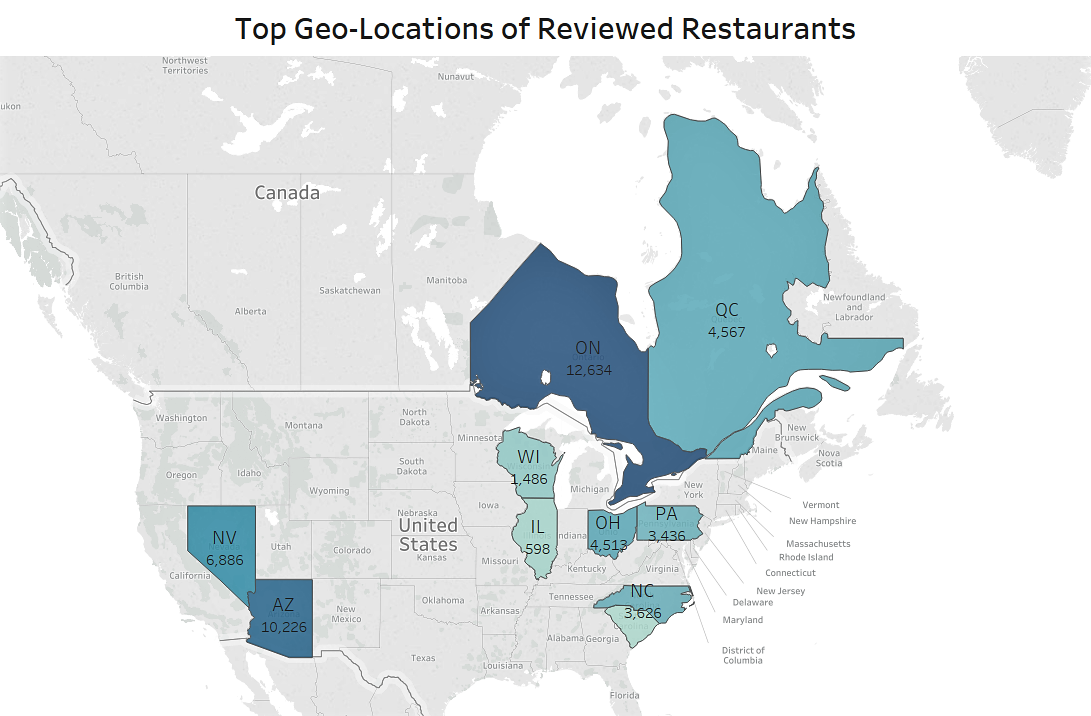
Figure 3.1: Geo-distribution of reviewed restaurant (showing top 10 locations).
As shown in the graph above, the top 10 geolocations account for 95% of all reviewed restaurants in our dataset: more than half (57.6%) of the reviewed restaurants in our dataset are located in Ontario (Canada), Arizona, and Nevada, and another 31% of restaurants about evenly distributed in Quebec, Ohio, North Carolina. While Ontario and Quebec, Canada do have two of the most number of reviews, all or the vast majority of these views are written in English and thus would not impact the results for later analysis.
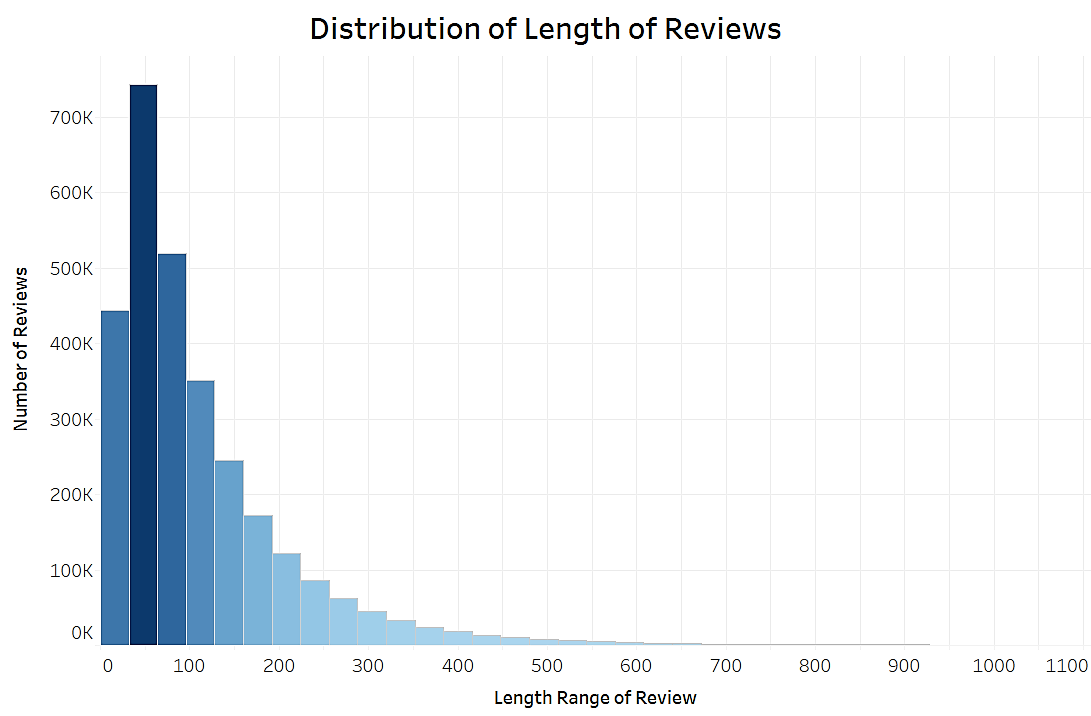
Figure 3.2: Distribution of length of reviews in dataset.
The average length of reviews is at 111 words and the most common length is around 50 words, typical of the the “microblog” nature of online text, but we do have an extremely long right-tail indicating a small proportion of quite lengthy reviews, with about 6% of all reviews spanning from 300 to 1,000 words.
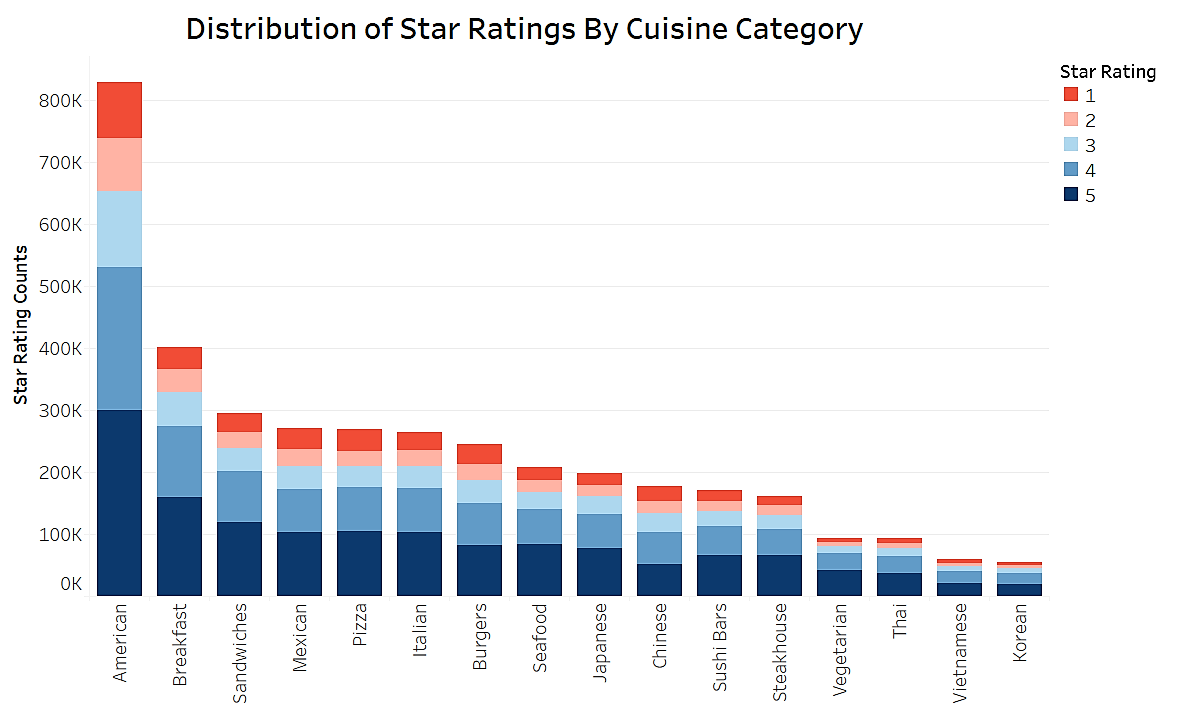
Figure 3.3: Distribution of star-ratings by cuisine category / restaurant type.
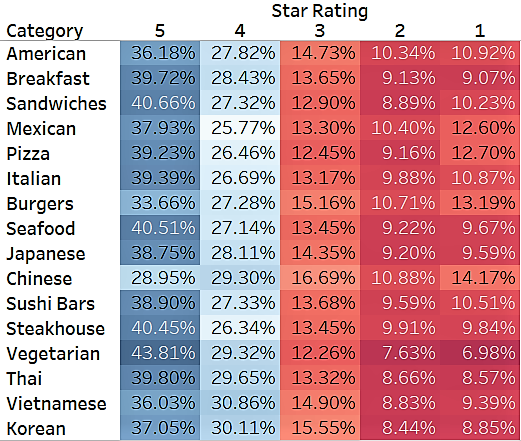
Figure 3.4: Percentage of star-ratings by cuisine category / restaurant type. Categories sorted in descending order of total number of reviews.
In terms of distribution of star ratings, the entire dataset is consists of 37% of reviews with a 5-star rating, 28% with 4 stars, 14% with 3, 10% with 2, and 11%. The distribution for each Cuisine Category / Restaurant Type, while mostly consistent with that of the entire dataset, does show some interesting scoring differences between fine-dining and casual eating scenarios: assuming our dataset random and unbiased, Vegetarian, Steakhouse, Seafood, Sandwiches restaurants tend to receive higher percentage of 5-star ratings, while Chinese, Burgers, Pizza, and Mexican restaurants have significantly higher percentage of 1-star ratings.
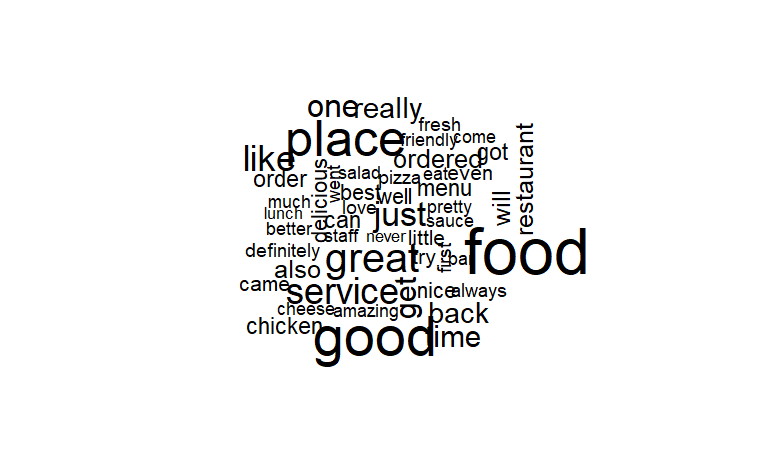
Figure 3.5: Word cloud of 50 most frequent words in corpus (pre-stemming). We can already see many potential “aspects” and associated “sentiment” that we would like to extract next.
3.2 Common Topics (LDA)
3.2.1 N-Gramming
Using the n-gramming method with hybrid cutoff thresholds discussed in the Methodology section, 2148 bigrams and 406 trigrams (and larger n-grams) were identified. Below shows the top and most representative n-grams identified in our corpus, and it is evident that the method successfully identified context-specific phrases that should be processed as single tokens.
| Bigram | p-value |
|---|---|
| go_back | 0 |
| high_recommend | 0 |
| las_vega | 7.6e-201 |
| great_food | 1.06e-75 |
| happi_hour | 1.19e-75 |
| custom_servic | 2.73e-26 |
| Trigram | p-value |
|---|---|
| cant.go_wrong | 0 |
| mac_n.chees | 0 |
| sweet_potato.fri | 0 |
| seat.right_away | 7.16e-228 |
| kung_pao.chicken | 8.85e-119 |
| fast_food.chain | 1.24e-79 |
3.2.2 LDA
While no “ground truth” exist for topic modeling results, we may expect to see category-aspect pairs such as Food / Drinks (taste, portion, price, options), Service (timeliness, friendliness), Ambience (noise level, occasion), Location, and Restaurant in general (cuisine category, restaurant type) etc.. We check if these targeted aspects can be recovered automatically.
| Topic 1 | Topic 2 | Topic 3 | Topic 4 | Topic 5 |
|---|---|---|---|---|
| place | burger | just | restaur | tabl |
| locat | chicken | pizza | delici | order |
| sandwich | sauc | get | meal | ask |
| day | flavor | eat | salad | us |
| bar | fri | like | menu | said |
| alway | order | place | amaz | server |
| beer | tast | think | dinner | servic |
| love | good | im | steak | time |
| friend | meat | price | great | went |
| great | like | realli | bread | one |
When trained on the entire corpus, LDA identified topics that are in general consistent with the expectation above: Restaurant (Ambience and Location) (Topic 1), Food-quality (Topic 2, more casual or lunch style), Food-price / dining experience (Topic 3), Food-options / quality (Topic 4, fine-dining or dinner style), Service (Topic 5). The food-related topics, however, do seem to contain tokens representing a mix of aspects (price, taste, variety). In other words, the food topics need more discriminating differentiation.
One potential explanation for this drawback could be the various but unevenly distributed cuisine categories we have in the corpus: while service and restaurant ambience / location may be shared topics containing similar tokens regardless of the cuisine type, food-related topics and associated tokens are likely to be more category-specific or even restaurant-specific. In response, we experiment with running LDA on segmented corpus for each cuisine category.
| Topic.1 | Topic.2 | Topic.3 | Topic.4 | Topic.5 |
|---|---|---|---|---|
| spici | sauc | meat | like | korean |
| bulgogi | side | flavor | just | restaur |
| soup | bbq | chicken | even | place |
| dish | improp | great | server | delici |
| hot | good | food | one | korean_food |
| rice | tri | littl | come | sushi |
| tofu | pull_pork | tast | us | make |
| stone | pig | well | tabl | best |
| pork | nice | eat | order | lot |
| bowl | rib | taco | time | authent |
When trained on corpus segmented by cuisine category, Food topic and corresponding top terms become much more category-specific. As illustrated in the results from Korean category corpus, specialty-food-related tokens are extracted and grouped into topics (Bibimbap-related in Topic 1, Korean BBQ-related in Topic 2) in addition to more general topics seen in the entire corpus (Food-quality in Topic 3, Service in Topic 4, Restaurant in Topic 5).
3.3 Restaurant Opinion Mining
3.3.1 Aspect Extraction
Unlike the extraction of common topics, our analysis of highlights (aspects) and corresponding sentiment is specific to each restaurant. To illustrate the opinion mining process, we use results for a randomly picked restaurant (Kitchen M in Markham, Ontario). Based on 73 reviews on this restaurant, 32 aspect terms were extracted (in order of most mentioned, by number of reviews):
\[ \begin{aligned} food,\ place,\ service,\ dish,\ restaurant,\ menu,\ rice,\ soup,\ tea,\ table,\\ meal,\ cafe,\ price,\ sauce,\ drink,\ portion,\ noodle,\ staff,\ congee,\\ lunch,\ option,\ spaghetti,\ breakfast,\ dessert,\ waitress,\\ cheese,\ area,\ style,\ order,\ space,\ sandwich,\ steak \end{aligned} \]
3.3.2 Aspect Categorization
We previously discussed two approaches for categorizing extracted aspect terms: one is assigning each term to the closest pre-defined category based on cosine similarity, and the other is automatically identify them with clustering without making presumptions about the categories. For the first approach, we decided not to use the pre-defined categories of SemEval (Food, Drinks, Service, Ambience, Location, Restaurant) but rely on the LDA results for our corpus (Food, Service, Restaurant) since the latter is consistent with the former but more representative of our corpus.
The results, as shown below, are not especially satisfying. Each category has a few aspects improperly assigned, most significantly in the Restaurant category, where a collection of words (‘noodle’, ‘congee’, ‘waitress’) bearing clear categories were wrongly assigned. With a closer examination, we realized that for many words, their cosine similarity to different pre-defined categories can be quite similar, and thus the assignments were made with little confidence. In addition, regardless of categories, extracted aspects all belong to the larger domain of restaurant characteristics, and thus are semantically close by nature.
| Category | Aspect terms assigned to this category |
|---|---|
| Food | ‘spaghetti’, ‘sauce’, ‘dish’, ‘soup’, ‘drink’, ‘food’, ‘portion’, ‘table’, ‘rice’, ‘tea’, ‘place’, ‘lunch’, ‘sandwich’, ‘meal’, ‘dessert’, ‘cheese’ |
| Service | ‘option’, ‘price’, ‘area’, ‘staff’, ‘service’, ‘order’, ‘space’ |
| Restaurant | ‘menu’, ‘style’, ‘cafe’, ‘restaurant’, ‘breakfast’, ‘noodle’, ‘congee’, ‘waitress’, ‘steak’ |
For the second approach, we cluster the extracted aspects using their word embedding representations based on the 300-dimensional, 42B pre-trained GloVe model. The result shows that the aspects can be approximately grouped into 3 clusters of dishes, food & drink types and dining experience attributes, generally consistent with the LDA results, but is also lacking more discriminating differentiation within topics.
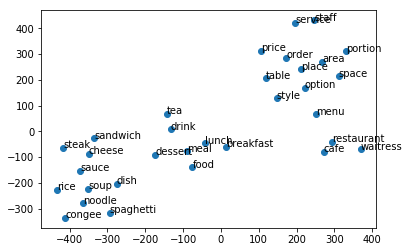
Figure 3.6: t-SNE visualization of clustering results for extracted aspects using vector representations from GloVe.
Since neither approach derived very satisfying result for categorization, we decide to focus on the aspect level for sentiment analysis, and postpone the aggregation of categorical scores for the scope of this project.
3.3.3 Sentiment Analysis
In the Methodology section, we discussed two refined lexicon-based sentiment analysis implementations, VADER and TextBlob. While they had decent performance on common challenging use cases, it is worthwhile to do a sanity check on whether they can capture the overall sentiments in our review corpus. Using the overall star rating as proxy for review polarity, we perform sentiment analysis on all reviews in the corpus and compare the two tools’ ability to recover the general polarity of reviews. From the graphs below, it is evident that polarity scores derived by TextBlob have better correlation with the star ratings and thus may be more suitable for our sentiment analysis task.
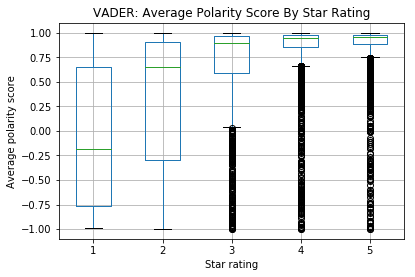
Figure 3.7: Sanity check with candidate sentiment analysis tools. VADER, while attuned to distinctive expression patterns in social media context and sensitive to intensity of polarity, may focus much on the nuances but lose grip on the overall polarity. TextBlob, on the other hand, shows good correlation with the actual star ratings.
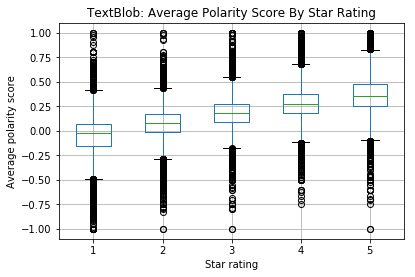
Figure 3.7: Sanity check with candidate sentiment analysis tools. VADER, while attuned to distinctive expression patterns in social media context and sensitive to intensity of polarity, may focus much on the nuances but lose grip on the overall polarity. TextBlob, on the other hand, shows good correlation with the actual star ratings.
TextBlob’s better performance was further confirmed by results for individual review text. For each of the extracted aspects of a given restaurant, all review text concerning the aspect are collected. VADER and TextBlob are then used to perform sentiment analysis on each of the review text. The table below shows all review text in the corpus for our example restaurant concerning the aspect ‘price’ along with the corresponding polarity scores derived by both tools.
| Review text concerning ‘price’ | VADER score | TextBlob score |
|---|---|---|
| ‘the prices are fairly good’ | 0.44 | 0.70 |
| ‘price is very affordable’ | 0.00 | 0.20 |
| ‘price are very reasonable’ | 0.00 | 0.26 |
| ‘their price is reasonable’ | 0.00 | 0.20 |
| ‘Prices are reasonable’ | 0.00 | 0.20 |
| ‘The price seems above average’ | 0.00 | -0.08 |
| ‘high prices’ | 0.00 | 0.16 |
| “Kitchen M doesn’t charges high prices” | 0.21 | 0.16 |
| ‘they gave you decent food for relatively good price’ | 0.44 | 0.43 |
| ‘Another plus is the affordability; you get enormous portions for Scarborough prices’ | 0.00 | 0.00 |
| ‘The prices are cheap here’ | 0.00 | 0.40 |
| ‘the price is a little too high for this type of food’ | 0.00 | -0.01 |
| “you really can’t expect much for the price you pay” | -0.10 | 0.20 |
| ‘good price’ | 0.44 | 0.70 |
| ‘dinner specials for a good price’ | 0.44 | 0.70 |
| ‘Very filling for a good price’ | 0.49 | 0.45 |
From the results above, it is evident that words bearing context-dependent sentiment impose a challenge for lexicon-based methods in general. In the examples above, cheap and affordable should carry positive sentiment while high carries negative when associated with price, but the words themselves do not necessarily have a polarity, and can even carry opposite polarity when associated with different context (eg. high price is negative but high score can be positive). This limitation of lexicon-based method is hard to resolve, since the unit of analysis in these approach is often words, and thus even with the incorporation of semantic patterns only limited of info can be incorporated from the context.
The final step in our analysis is to derive an averaged score for each aspect and summarize the highlights (most-mentioned and most-positively-reviewed) of the given restaurant. Below is the summary for the example restaurant. Interestingly, our summarized highlights do overlap with the ones provided by Yelp for Kitchen M (our example restaurant), though Yelp seems to focus more on the “most-discussed” part when defining highlights and gives little explicit attention to the sentiment associated.
| Highlight | Representative review text |
|---|---|
| Price (0.27) | “price are very reasonable” |
| Portion (0.24) | “The dishes I’ve ever ordered from the restaurant always come in a large portion” |
| Food (0.23) | “food here is okay” |
| Tea (0.19) | “The Hong Kong style milk tea was also great” |
| Place (0.14) | “It’s a nice HK cafe kind of place” |
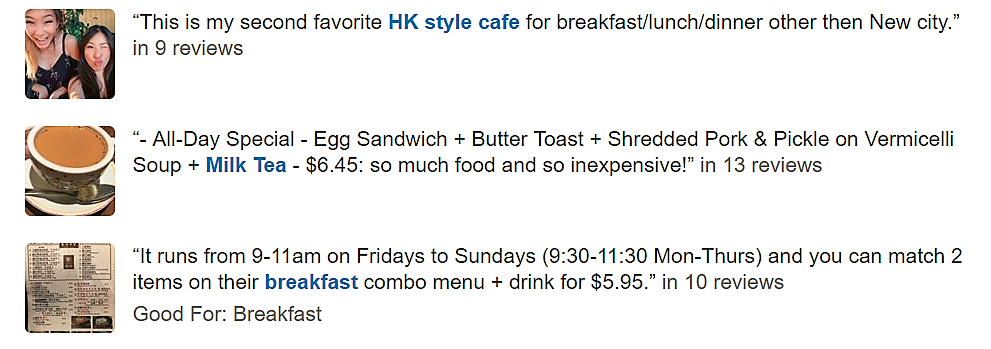
Figure 3.8: Screenshot of Yelp-provided highlights for the example restaurant. These highlights, though selected mainly based on number of reviews mentioning it, are not necessarily the most-positively-reviewed. Interestingly, these aspects do overlap with the ones extracted with our sentiment-focused approach.