Chapter 6 Passing Networks
The main motivation behind this project is to understand the passing structure of Duke players in a game to create a better metric to evaluate players in the game of basketball. For this, each game was decomposed into individual possessions. Players who are in possession of the ball during each of the possessions are identified as vertices, and their passes to other players are edges in a pass network. Each vertex contains attributes about the player (e.g. fouls in the game), and each edge contains attributes about the pass (ie. distance passed).
6.1 A Breakdown of a Passing Network
6.1.1 Game Network
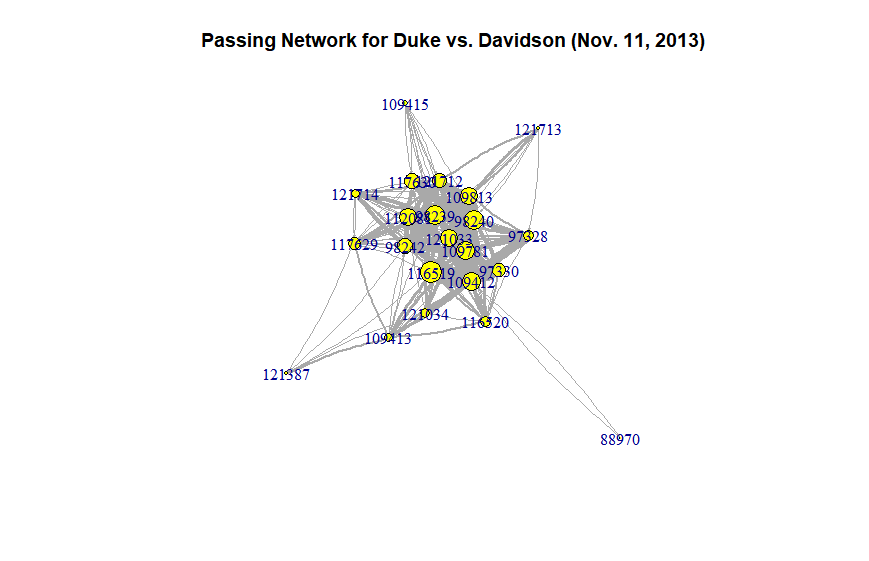
Below is an example of a passing network for an entire game, where each number represents the unique id of a player.
6.1.2 Possession Network
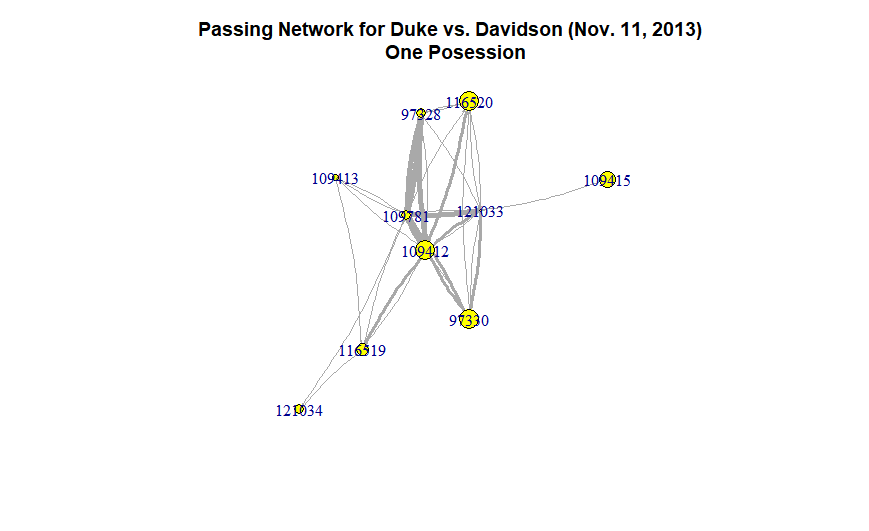
Breaking it down into a single game possession, the network becomes reduced to a smaller network. One challenge in identifying a posession was the inconsistency of the dataset’s shot clock. For this, a new possession for this paper is defined as the moment when a team turns over the ball to the other team. For this, a possession may contain more than five players if players sub in/out within a possession.
6.1.3 A Vertex and an Edge
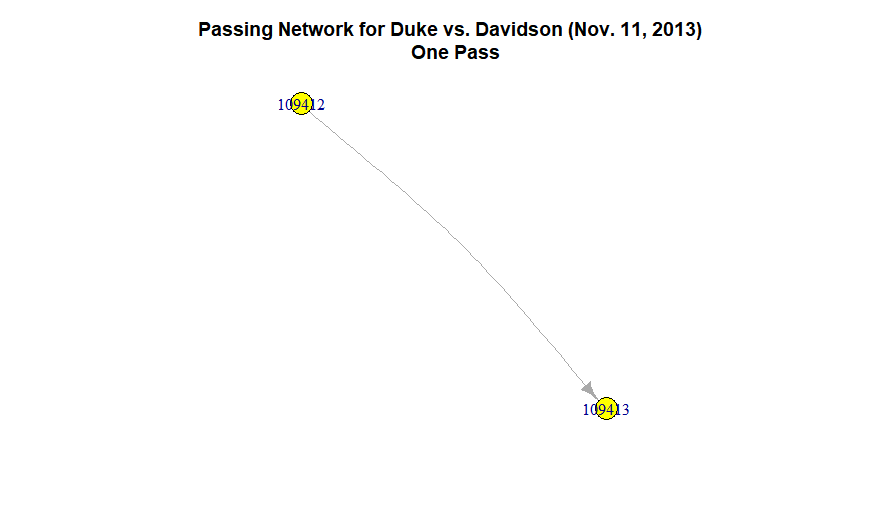
A single pass between player \(109412\) and \(109413\) has a thin line because it only occurred once during this game. The arrow indicates the direction of the pass, and when checking the edge attribute between these two vertices, the distance of the pass between \(109412\) and \(109413\) is 22.83 units. Looking at vertex attributes, player \(109412\)’s position is a guard.
6.2 Initial Analysis of Passing Networks
Simply looking at a graph can reveal important characteristics about a player’s role within a team. On a possession level, if a player receives many passes (as noted by a thicker edge), then he has a more central role on the team, and his teammates clearly rely on him to make good passs.
Other interesting network calculations are betweeness centrality; this metric can be visualized by the passing network, and noted as the popularity of a player based on how connected/central he is to the play. For this, returning to the Duke vs. Davidson game, we can note that Player \(109415\) is an important and valuable player for Duke because his betweenness centrality score is the highest score as denoted by the table below:
| 109412 | 109781 | 121033 | 116519 | 116520 | 109413 | 97330 | 97328 | 121034 | 109415 |
|---|---|---|---|---|---|---|---|---|---|
| 21.7 | 21.5 | 14.5 | 12.5 | 7.5 | 5.5 | 2 | 1.8 | 0.5 | 0 |
Furthermore, we can presume that players who are most connected to the ball should be able to best handle the ball. For this, we expect the players with the highest betweeness score to be the starters for Duke’s 2013-2014 Men’s Basketball team. Checking the starting line-up from Duke Men’s Basketball for the 2013-2014 season, the betweenness score correctly matches Coach K’s starting line-up.